Population Ecology
A population a group of individuals of the same species occupying a given area. It is not just a group of people; it can also mean plants, animals, et. The individuals in a population have a shared gene pool.
Characteristics for Populations
Population Size
Population Size is the number of individuals that contribute to a population's gene pool. The size increases based on two things: birth rates and immigration (arrival of new residents from other populations of the species) and decreases based on two things as well: death rates and emigration (individuals that permanently move out of an area).
Age Structure
Age structure is the number of individuals in each several to many age categories.
Population Density
Population density is the number of individuals in some specified area or volume of a habitat.
Population Distribution
Population Distribution is the general pattern in which individuals of the population are dispersed through a specified area.
Reproductive Base
Reproductive Base is actually and potentially reproducing individuals.
Population Growth
Exponential & Logistic Growth
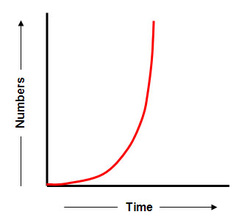
Populations can be described using exponential growth. Exponential growth is when the growth of a population over increments of time plots out as a J-shaped curve (shown left). But when a population hits the maximum amount of individuals it can hold, called carrying capacity, the growth will flat line and change into logistic growth (shown below). Logistic growth by definition is a low-density population slowly increases in size, enters a phase of rapid growth, then levels off in a size once the carrying capacity has been reached.
Limiting Factors
A limiting factor is an important source that is short on supply. These limiting factors 'limit' the amount of growth that can occur in a population. Two important limiting factors are density-depentent controls and density-independent factors. Density-dependent controls limit the population growth by reducing the birth rate, increasing death and dispersal rates, or all of these. Some examples of density-dependent controls would be diseases, predation, parasitism, and competition for resources. Density-independent factors causes a population's death rate to rise independently of population density. A more simple version of that definition would be that natural disasters are density-independent factors. Some examples of density-independent factors would be floods, storms,
Survivorship Curve
A survivorship curve is a graph line that emerges when ecologists plot a cohort's age-specific survival in a habitat. There are three types of curves, each shown in the picture above. Type I is shown in green above. This curve shows a high survivorship late in life. An example of Type I would be elephants. Type II is shown in purple above. This curve shows a constant death rate at all ages. An example of Type II would be songbirds. Type III is shown in orange above. This curve shows a a high survivorship early in life. An example of Type III would be sea stars.
Demographic Transition Model
A demographic transition model is a model that shows four stages of population growth as show in the picture above. The model show birth and death rates, plus it usually shows relative population size.
